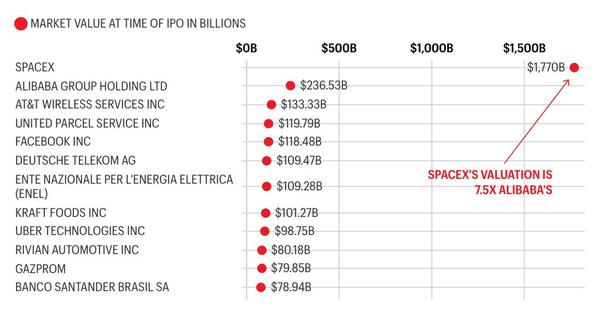
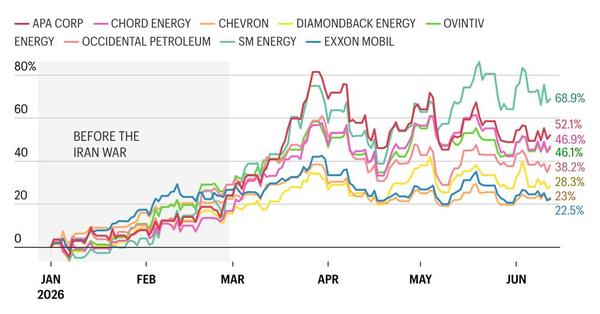
I know how to organize qualitative and quantitative data to make interactive visuals in Datawrapper. I've pulled data from the Bloomberg terminal to visualize the impact of the war in Iran on oil companies' market cap, adjusted the top 20 U.S. IPOs' valuations for inflation to see how SpaceX's IPO compares, and more. Scroll to see them!